This article will cover the revenue multiples from consumer tech companies from various industries including social media, marketplaces, gaming, e-commerce, and more.
We follow 59 publicly traded internet companies in different industries including social media, marketplaces, content distribution, gaming, e-commerce, payments, and new hardware.
The one thing these companies all have in common is that consumers are a customer/critical constituent in the business model. Given the diversity of industries, the multiples vary. Below is the data along with a few observations.


Social Media is Still Hot, but Revenue Multiples Came In
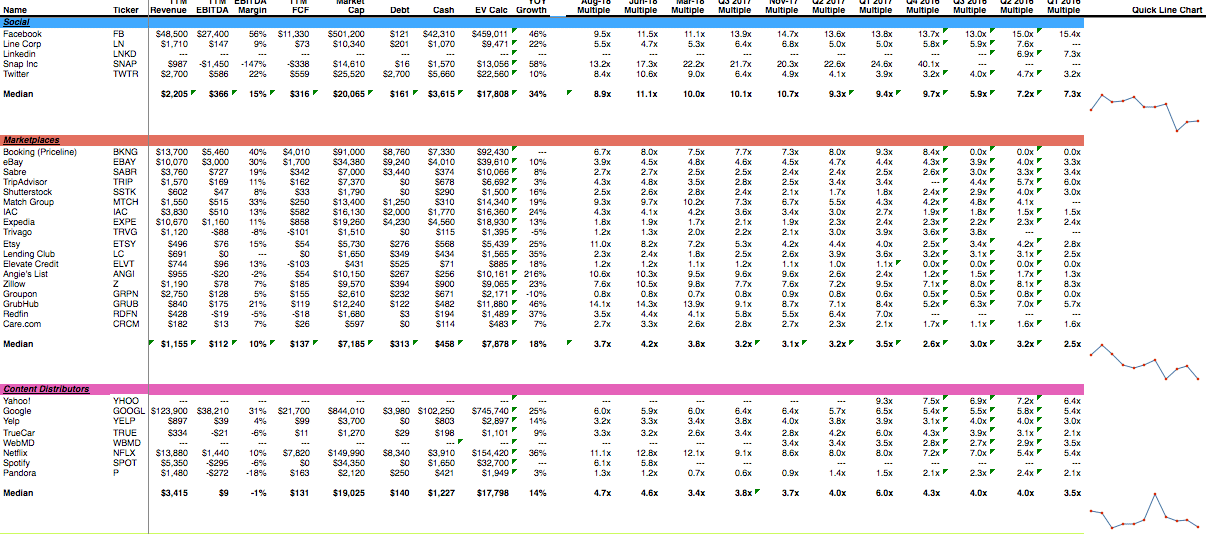
The median revenue multiples are now 8.9x with Snapchat and Facebook leading the way at 13.2x revenue and 9.5x revenue respectively. Line Corp’s revenue multiple is the only one that improved over the prior period, but the overall we still view revenue multiples for social media as quite strong.
Marketplaces Are at 3.7x
Revenue multiples for marketplaces fell to 3.7x. The eighteen companies in this data set are diverse. However, on median they marketplace companies generate $1.1bln in revenue with 18% YOY growth and positive EBITDA ($112mm) and cash flow ($137mm). Note the multiple is on revenue, not GMV (Gross Merchandise Volume).
Content Stayed Strong
Content distributors were showing weakness for the past year but rebounded materially to 4.6x in June and 4.7x in August. Netflix’s revenue multiple continues to be the outperformer at 11.1x and Google’s revenue multiple is strong at 6.0x. It’s the rest of the group which includes underperformers like Pandora that is suppressing the industry’s multiple overall, although Spotify is trading at a healthy 6.1x. Google is obviously the behemoth in the space. Google has $102bln of revenue over the past 12 months whereas the median of the group is $1.2bln.
Gaming Isn’t Growing in Revenue Multiples
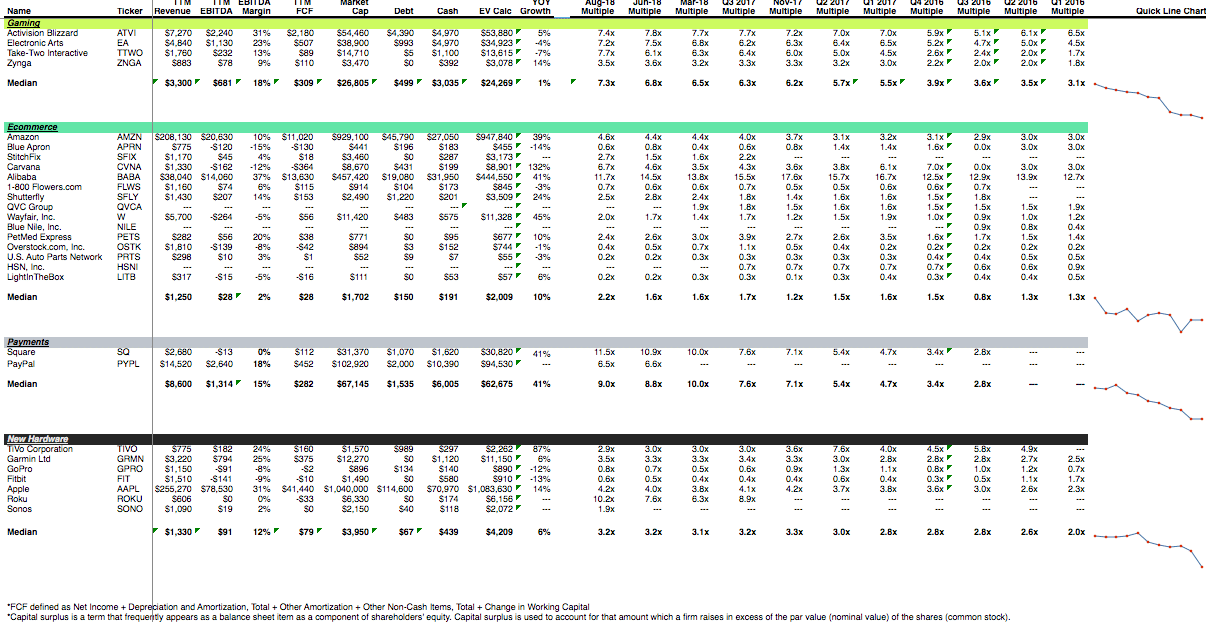
With all the hype around esports, the big public gaming companies are not growing. The median YOY growth of gaming companies is only 1%. Their median revenue multiple of 7.3x is strong and continuing to trend up. It’s a bit perplexing to us as the sector’s YOY growth is only 1%. This is especially surprising given the median revenue is material at $3.0bln and EBITDA is very strong at $681mm.
E-commerce Broke 2x
The sector is the least attractive to investors, with a median revenue multiple of 2.2x. Although, note the sector hasn’t broken 2x at any time since we’ve been tracking the data. There is a big difference between what we would call premium e-commerce like Alibaba and Amazon (11.7x and 4.6x), versus soft e-commerce like Blue Apron (0.6x revenue). Recall not too long ago the Wall Street Journal put out a scathing article on the meal box delivery sector, with a VC from Greycroft quoted as saying he knows no one that is actively looking at the space anymore — and Greycroft made money on Plated.
Payments Space is Inconclusive
We only have two companies to look at in payments so we try not to draw generalizations about the space. We are glad to hear Stripe is considering an IPO so we’ll have another data point shortly.
Hardware is Consistent
Hardware is steady at 3.2x. Roku is the standout of the group (10.2x) followed by Apple (4.2x). Growth is slow in the space (6% median). However, revenue is a solid $1.3bln on the median with $91mm of EBITDA. Sonos, the newest addition to space is actually trading at a lower revenue multiple than the group at only 1.9x.
Sammy is a co-founder of Blossom Street Ventures. They invest in companies with run rate revenue of $2mm+ and year over year growth of 50%+. We can commit in 3 weeks and our check is $1mm. Email Sammy directly at sammy@blossomstreetventures.com.


