
This article is part of the Crunchbase Community Contributor Series. The author is an expert in their field and a Crunchbase user. We are honored to feature and promote their contribution on the Crunchbase blog.
Please note that the author is not employed by Crunchbase and the opinions expressed in this article do not necessarily reflect official views or opinions of Crunchbase, Inc.
Product-market fit is the north star for every startup, but this critical metric fails to account for the most important variable predicting startup success — team.
After interviewing nearly 100 venture-backed startups with the support of Crunchbase and examining 10,000 early-stage job postings alongside AngelList, our firm, Basis Set, came to the conclusion that the most commonly shared attribute separating high-performing startups from low-performing startups was team-problem fit.
Finding team-problem fit
Team-problem fit is the alignment of a company’s early hires with its key strategic objective. By definition, startups are in the business of turning limited resources into disproportionately large outcomes. So, it would follow that the way a company chooses to allocate its first 10 roles matters a lot.
A company executing a land-grab strategy to quickly capture market share should have fewer engineers than a deep-tech company whose primary risk is shipping a product to market.
Early hires that matter
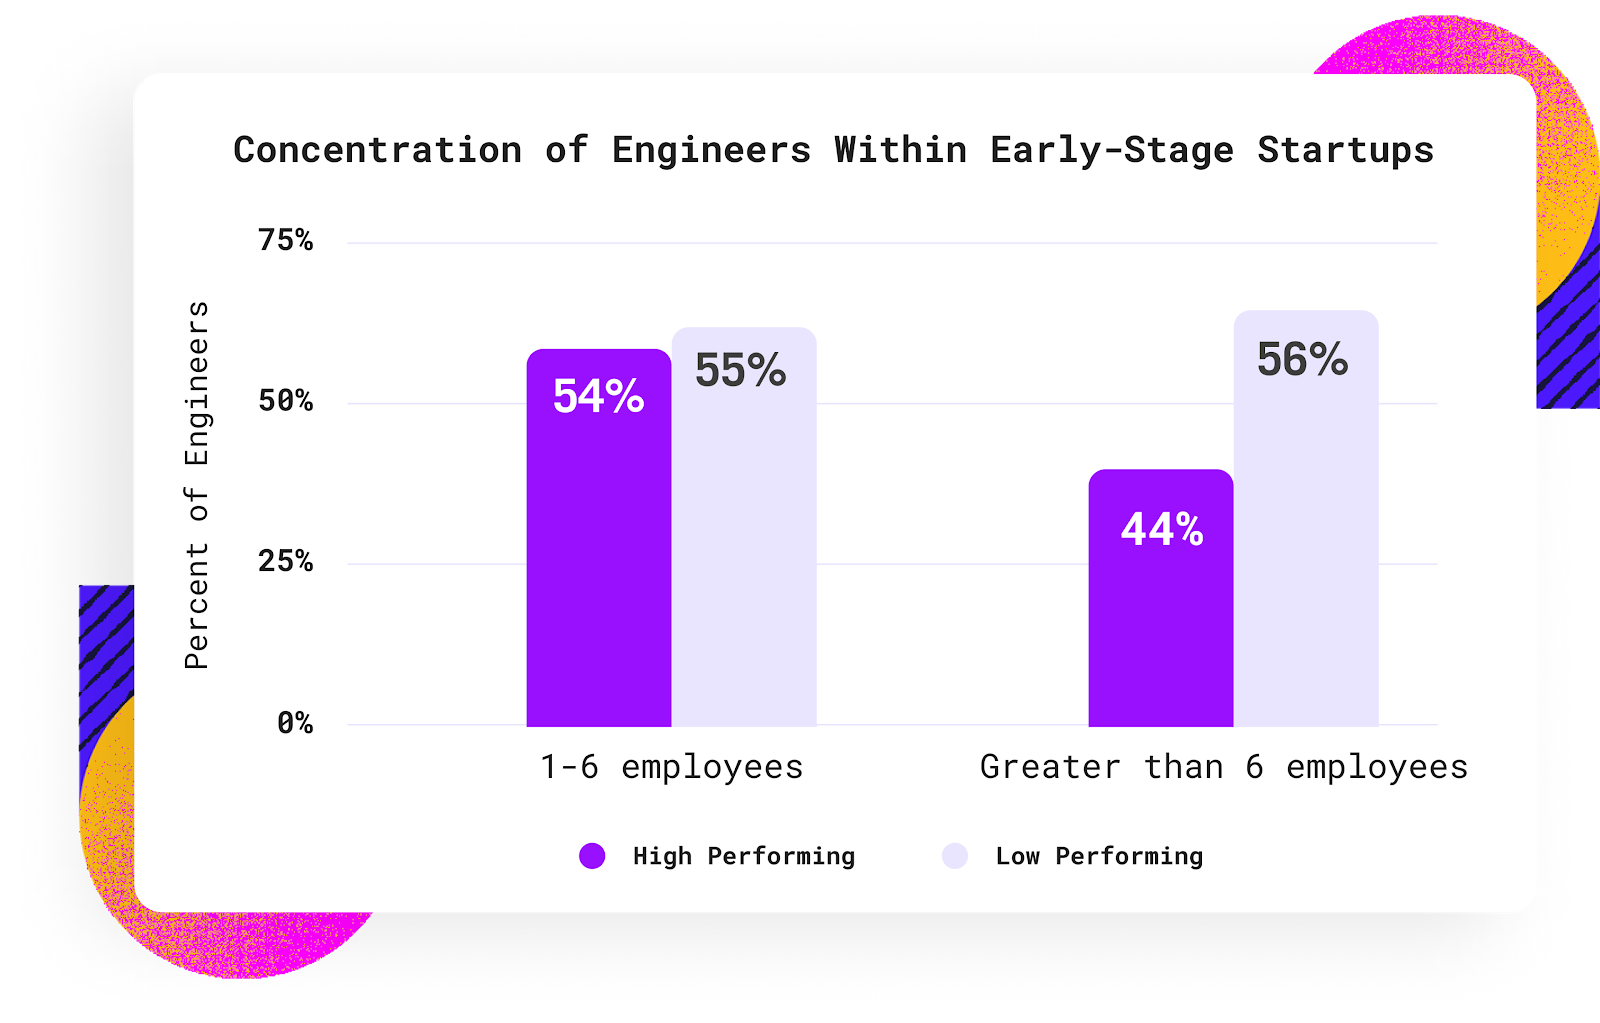
The concentration of engineers was equal between high and low-performing companies up until six employees. After this milestone, the makeup of high and low-performing companies started to diverge.
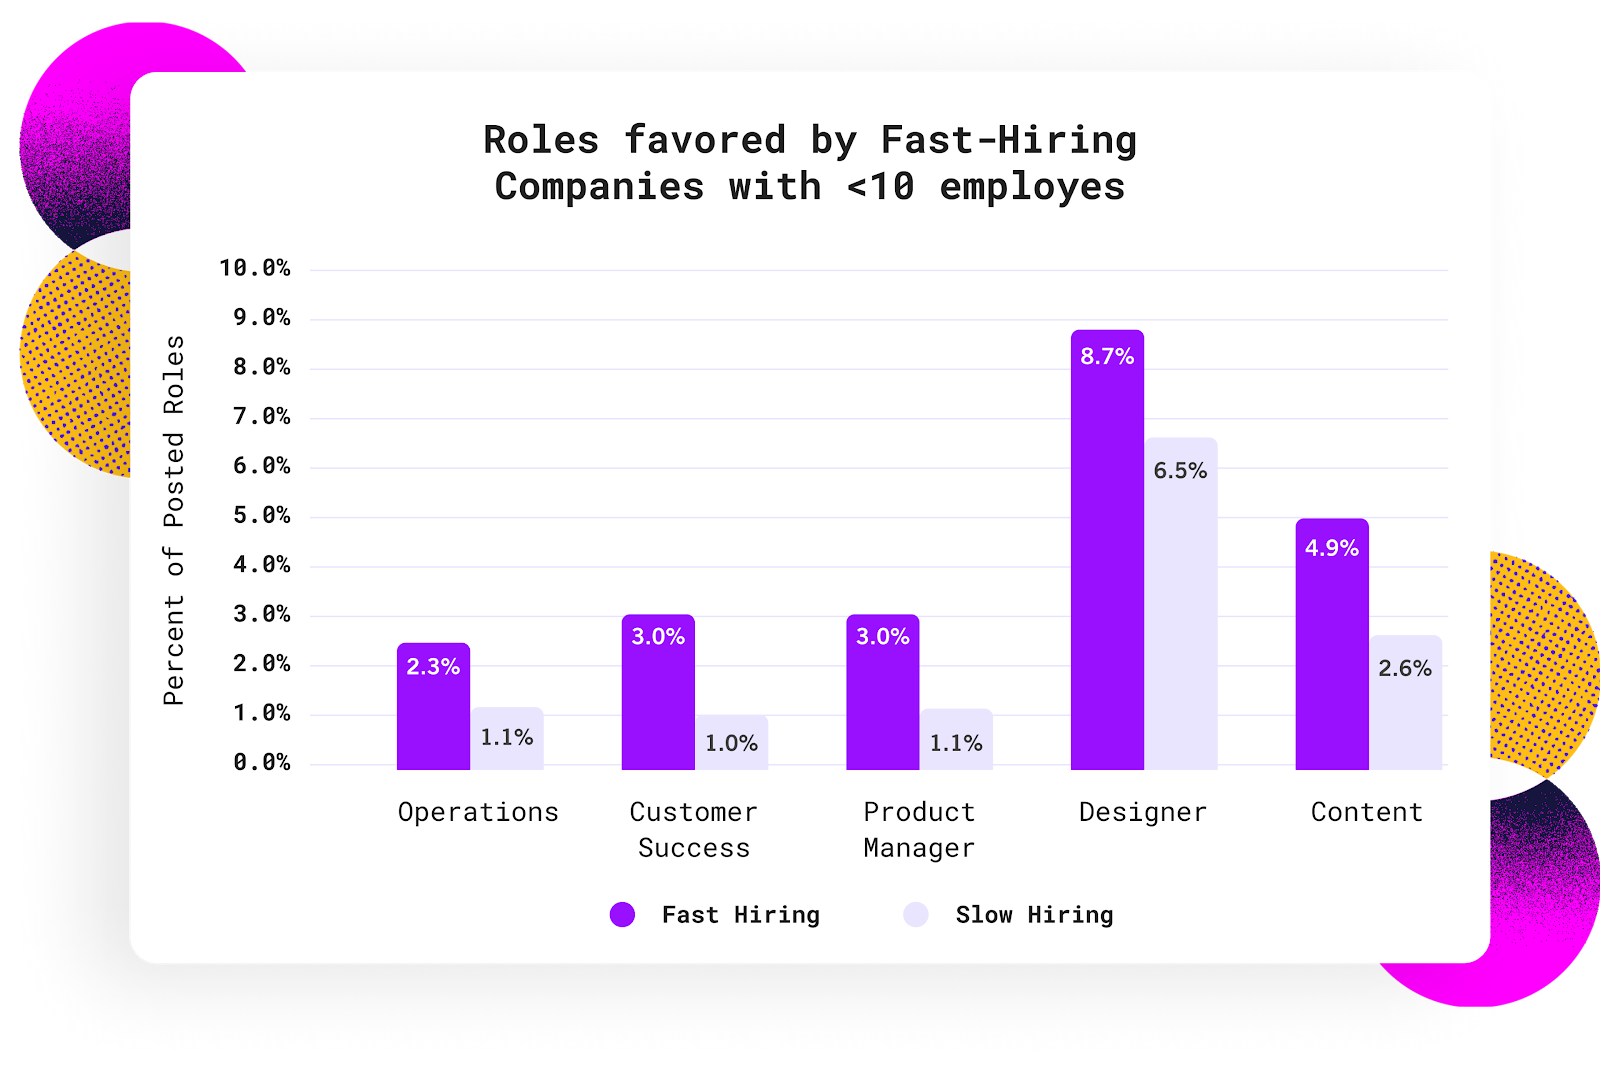
We found that content, design, product management, customer success and operations were the most commonly sought-after roles among high-performing companies — but most important was the job’s alignment with a given company’s winning playbook.
What else do high-performing companies have in common?
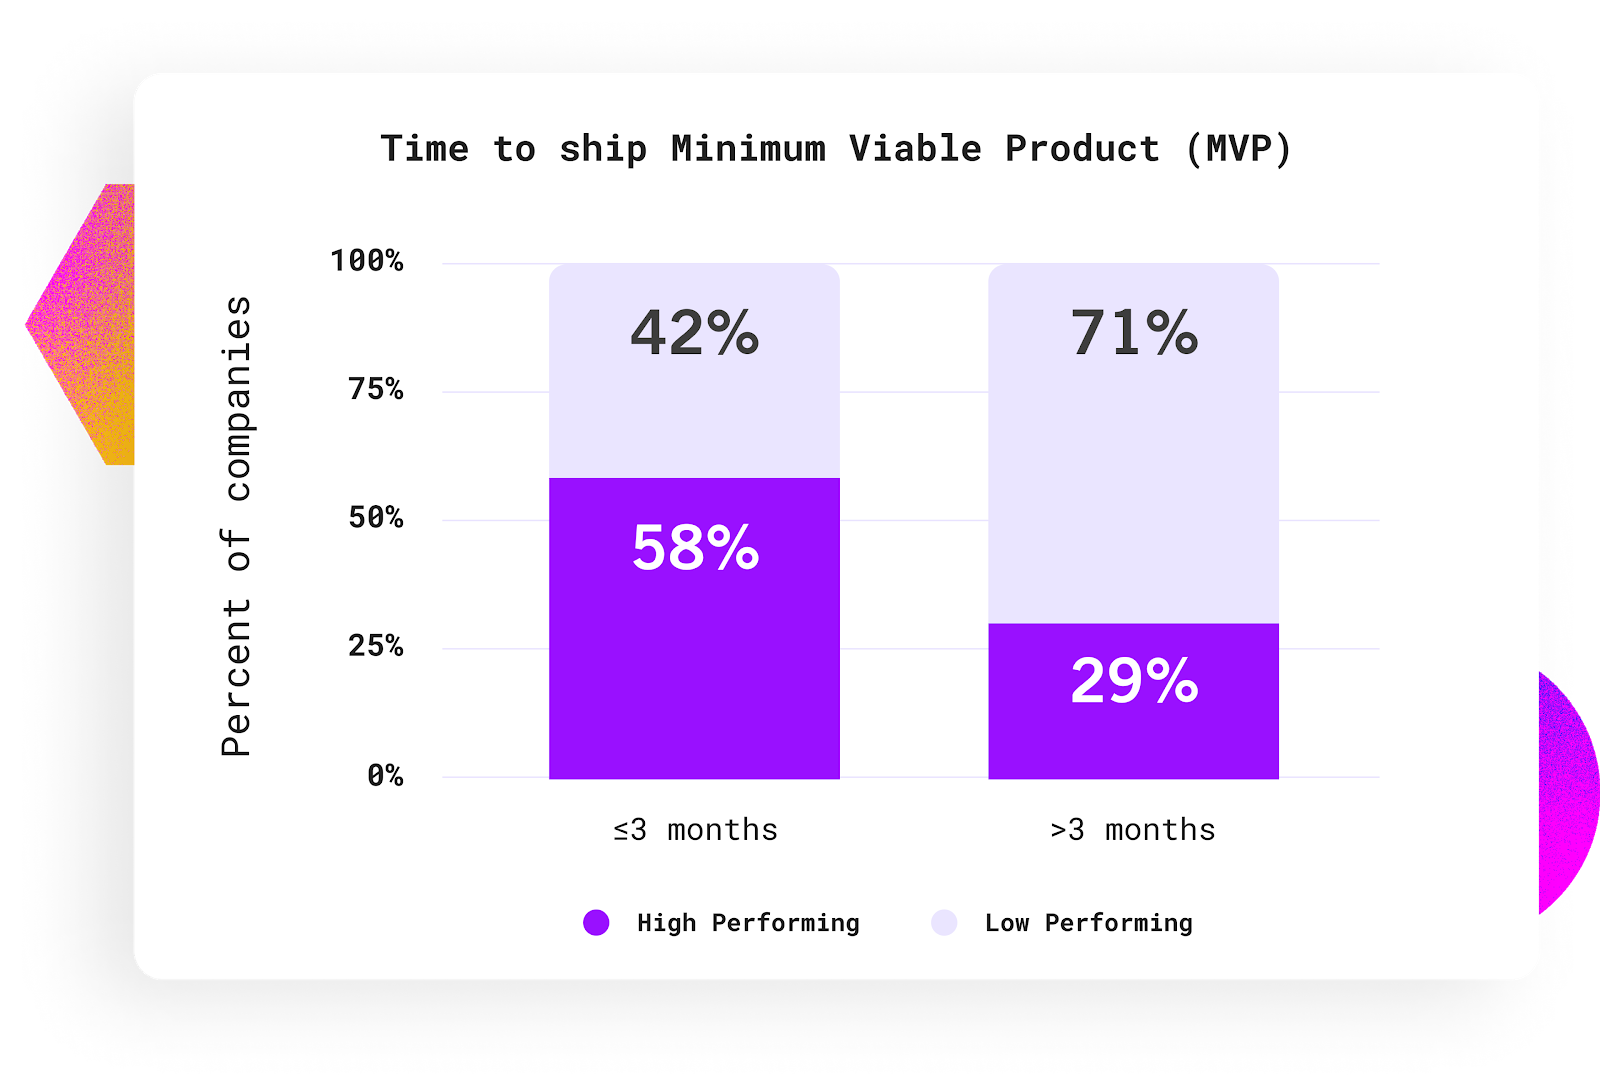
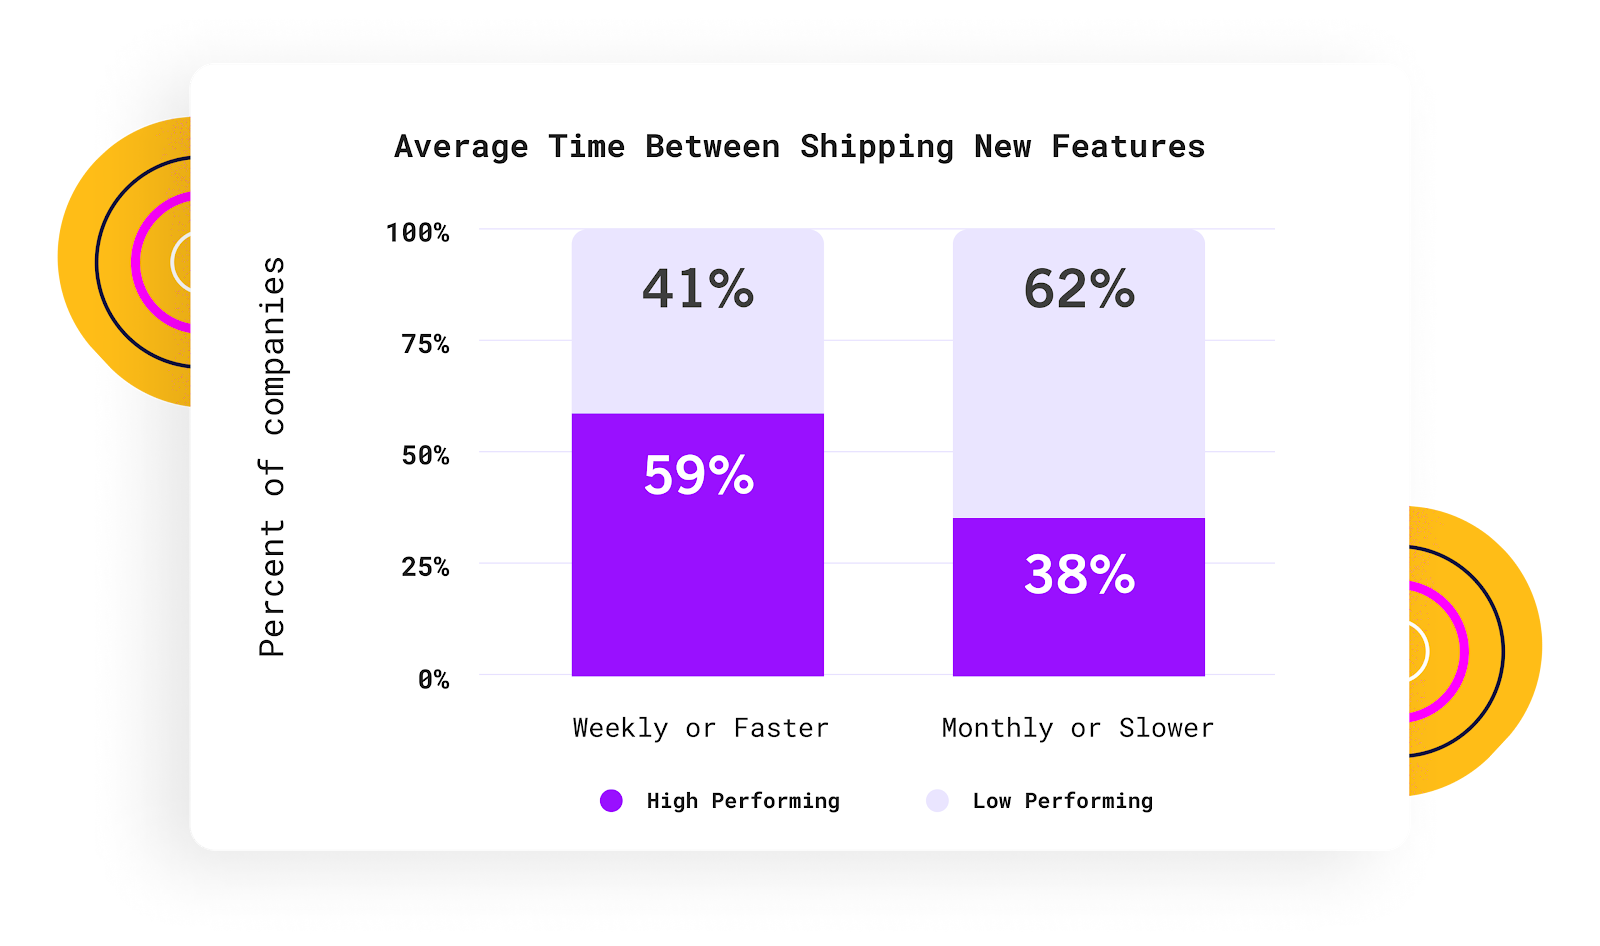
Aside from the importance of team-problem fit, we also identified four critical metrics universally associated with growth. Companies who shipped MVPs in less than three months and who shipped new features weekly or faster were twice as likely to be high-performing as those who didn’t.
Similarly, while customer acquisition cost (CAC) differed by business model and go-to-market, across all company categories, CAC was a universally important variable. High-performing companies on average had 5x lower CAC when compared to low-performing companies.
And lastly, while Miami and Austin have been capturing the headlines in recent months, the reality is that the future is remote. Across our entire data set representing over 1,000 early-stage startup employees, founders of high-performing companies expected 66% of employees to remain remote.
Full report
Check out the full report on the Basis Set website. In addition to these primary findings, we also break down six common company archetypes for both high and low-performing businesses so founders can benchmark their own companies.
Our research is part of our larger effort to democratize growth through the Hypergrowth Network by giving founders access to the strongest data, mentorship, and custom-built tools.