
StartupBlink, a global startup and innovation research center, has launched the Startup Ecosystem Rankings Index 2021. The 2021 Index ranks 1,000 cities and 100 countries worldwide, tracking both momentum and trends within the startup ecosystem since 2017. This year’s report also features many new sections including sections on Industry rankings, the Top Island Cities Ranking, Analysis by Sub Score, Analysis by Population, City Ecosystems in Unranked Countries, and even a ranking based on special entities such as Unicorns and Pantheons.
Click here to download the full Global Startup Ecosystem Index 2021 report.

The algorithm used to generate the rankings analyzes tens of thousands of data points powered by our global partners such as Crunchbase, alongside data gathered from more than tens of thousands of registered members on the StartupBlink Global Map.
Startup Blink’s partnership with Crunchbase has allowed it to feature and rank hundreds of ecosystems – highlighting data on thousands of startups in order to understand the quality and frequency of innovation, as well as trends, of ecosystems around the world.
StartupBlink’s Startup Ecosystem Ranking Criteria
Our country and city rankings have a total score, which is the sum of 3 columns measuring the following:
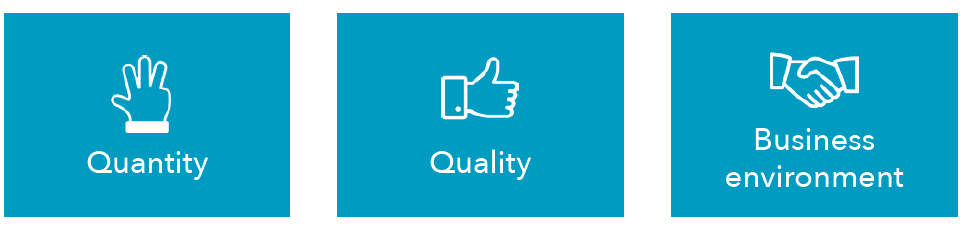
Based on the total score, we have put the ranking results into the tables covering the crucial information on each country and city that was ranked.
The Top Country Rankings
When compared with 2020, this year the top 5 countries have all maintained their rank from last year, however, there are several interesting insights.
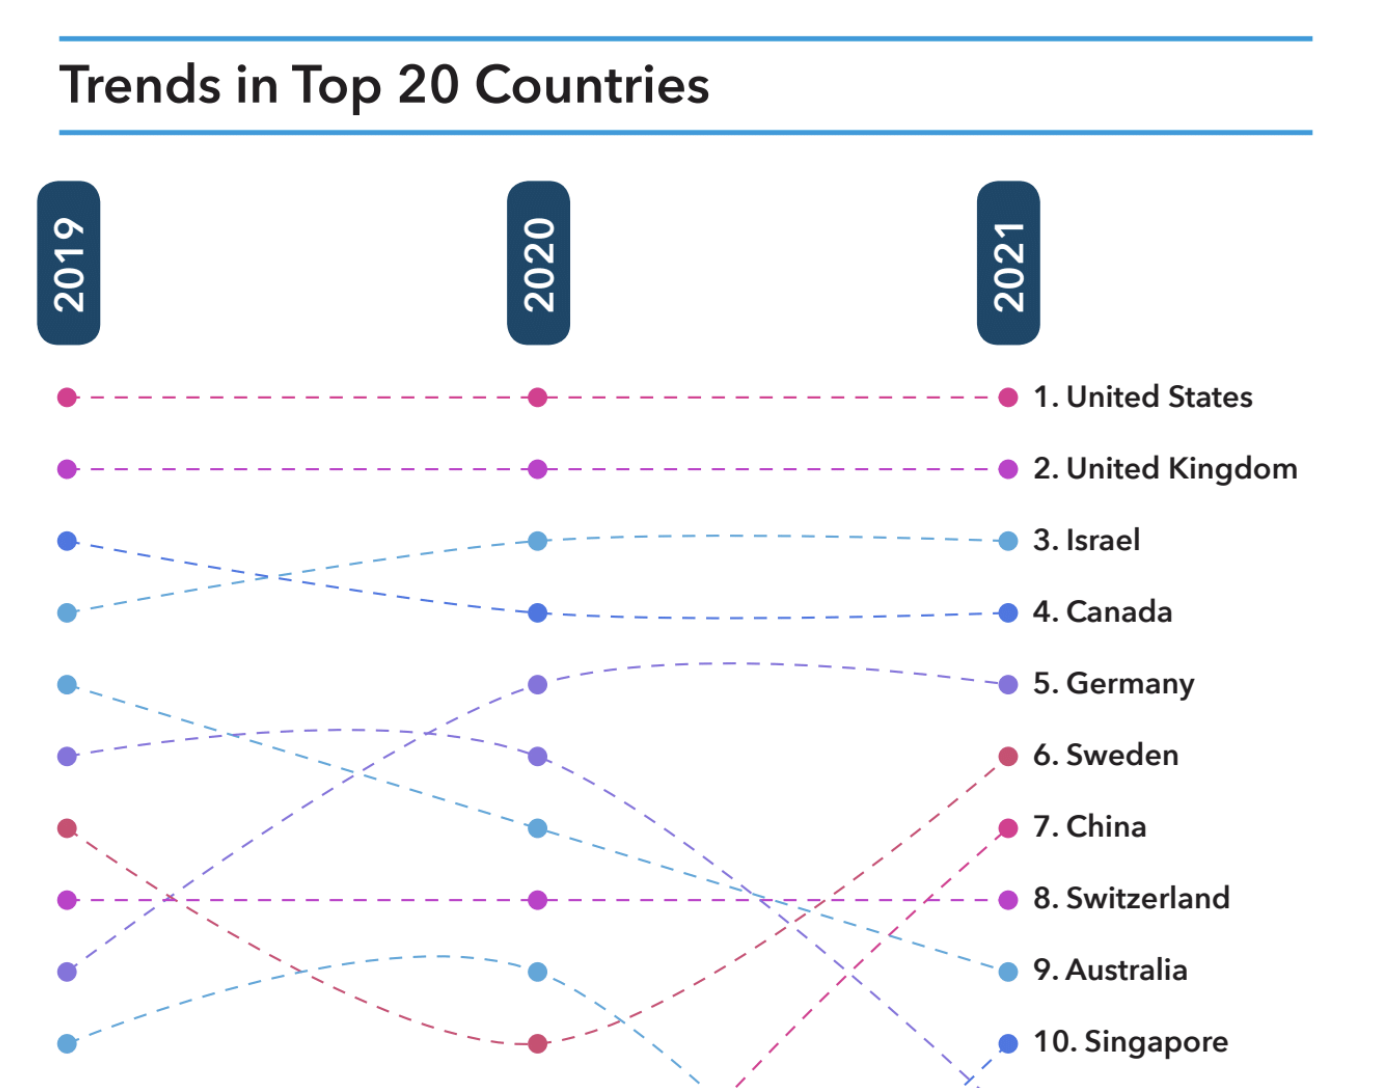
Firstly, the United States maintains a massive lead over the 2nd ranked United Kingdom, showing a strong and dominant innovation scene across the 267 USA cities ranked in this report.
Additionally, for the first time since 2017, it seems that Brexit does have some negative influence on the UK ecosystem. Another interesting development is a change in the group which we refer to as the “Big 4” Startup Ecosystems: the US, UK, Israel, and Canada. Canada is still ranked 4th, but it is now much closer to the startup ecosystem of Germany at the 5th spot than to the UK and Israel. Therefore, we can now relabel the term our “Big 3” club, led by the US with a massive gap over both the UK and Israel.
Top City Ecosystems
2021 has seen changes to the top 10 cities, with the top 5 this year being – San Francisco (1st), New York (2nd), Beijing (3rd), Los Angeles (4th), and London (5th).
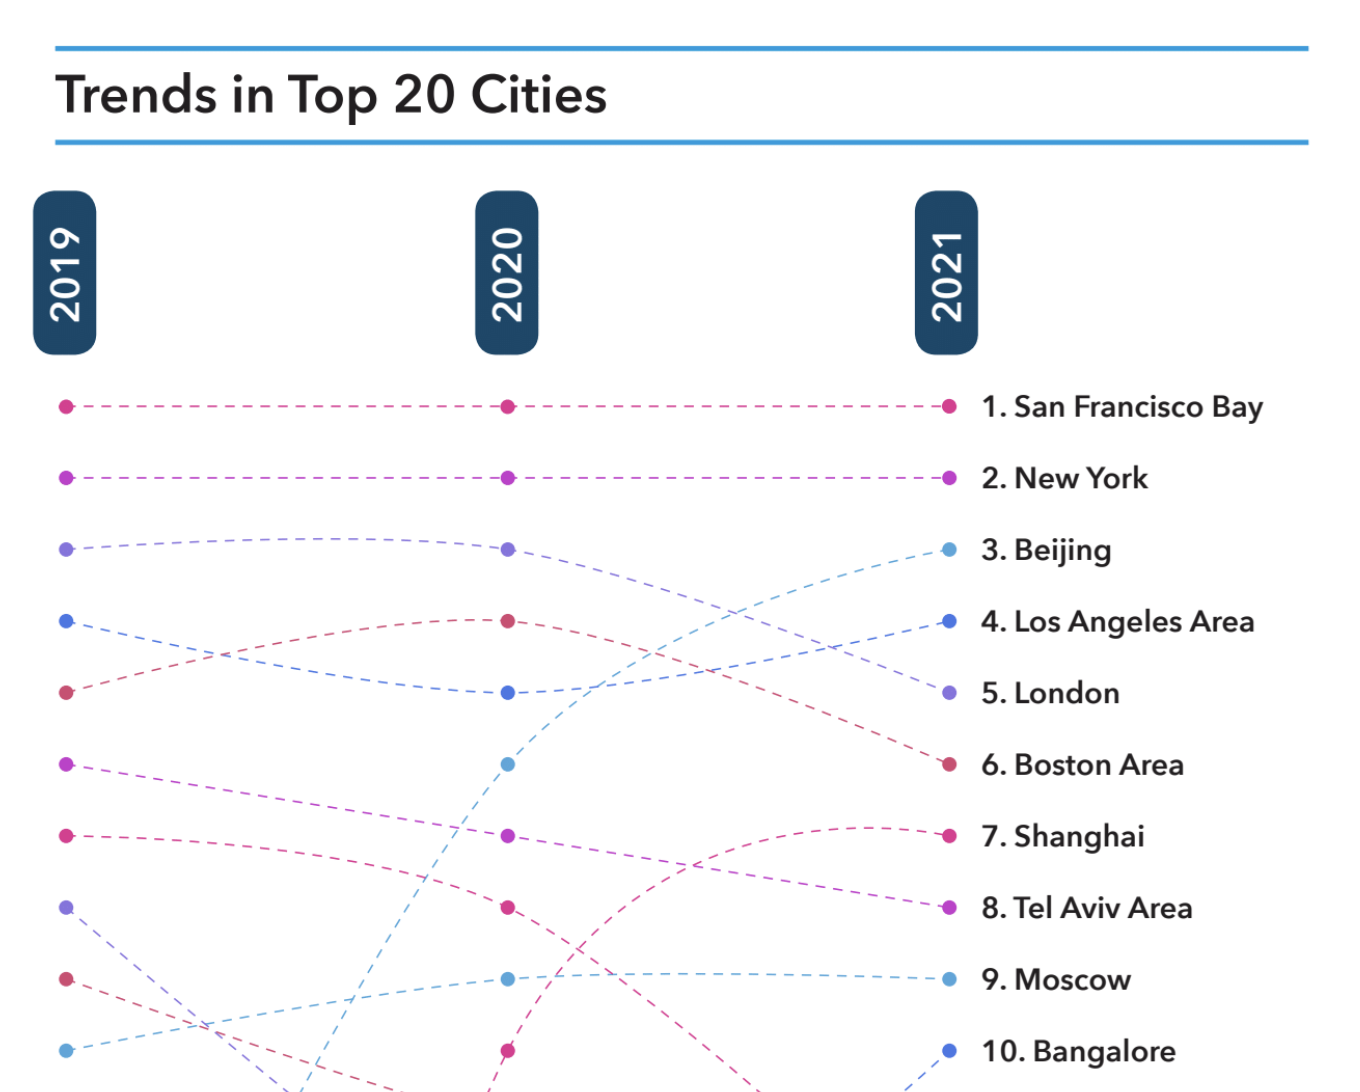
The top two startup ecosystems remain the same as they were last year: San Francisco and New York. San Francisco is the “supernova” of startup ecosystems, evidenced by its total score, which is almost 3 times higher than New York. However, this may eventually change. Like last year, New York deserves congratulations for building the 2nd strongest global startup ecosystem.
Beijing, now ranked 3rd after increasing 3 spots, is proof that the Chinese model of innovation is working. Ranked 4th globally is Los Angeles, a city which is becoming much more than an entertainment hub, and is now a truly robust global technological leader outranking ecosystems like London and Boston.
London, ranked 5th, is facing a challenging environment. Boston, ranked 6th, could not keep up with the excellent results of Beijing and Los Angeles, giving up 2 spots but still holding strong as a global leader. At 7th is an additional Chinese city, Shanghai, solidifying its position as a leading global hub and offering more proof of the outstanding growth rate of Chinese ecosystems.
At 8th, Tel Aviv is an international ecosystem representing the startup nation of Israel. At 9th is Moscow, a powerful hub with outstanding talent, but a more domestically driven ecosystem, catering mainly to the massive Russian market, albeit with the potential to go global if the geopolitical situation allows. At 10th, after increasing 4 spots, is the splendid ecosystem of Bangalore, a hybrid model of an international hub which also enjoys the advantages of the massive local market in India.
Industry Rankings
Based on a sample of nearly 100,000 entities, StartupBlink shows interesting trends related to main startup industries in regards to their activity level (number of startups) and scalability level (number of unicorns).

The industry in which we see the most activity and scalability is Software & Data with more than 24,000 startups and 255 Unicorns. The next most active industry is Social & Leisure Technology with more than 8,000 startups but a relatively low number of Unicorns at 26. On the other hand we have E-commerce & Retail Technology, an industry with a lower number of startups (less than 7,000), but the second highest scalability level with 119 Unicorns.
Other very active industries that also have high levels of scalability are Fintech, featuring more than 8,000 startups and 110 Unicorns and Health Technology, featuring more than 6,000 startups and 40 Unicorns. An interesting industry is Transportation Technology, featuring just above 2,000 startups in our map but undoubtedly highly scalable, with 55 Unicorns.
For the full report and more information, visit: report.startupblink.com
Eli David, CEO, StartupBlink
Christos Nicolaou, Digital Marketing and Content Manager, StartupBlink