This article will cover key learnings from SEG’s Q2 2018 SaaS Public Market Update including statistics and numbers around SaaS market growth, EBITA margin, and median revenue multiples.
Sammy is a co-founder of Blossom Street Ventures. They invest in companies with run rate revenue of $2mm+ and year over year growth of 50%+. We can commit in 3 weeks and our check is $1mm. Email Sammy directly at sammy@blossomstreetventures.com.
Software Equity Group just released their quarterly view of the SaaS market. SEG is a well respected M&A advisory firm and investment bank, and their quarterly review of the SaaS market is well worth the read. Below are the key takeaways from the report:
SaaS Market Growth Continues to Be Strong
The median revenue of the companies on the list is $273mm and year over year growth is 29%.
EBITDA Margin Continues to be Negative
“On a median basis, the SEG SaaS Index has not been
EBITDA positive since 2013, but has been steadily approaching positive territory in recent quarters.” 55% of the companies were unprofitable. However, 78% of the companies generate positive cash from operations thanks to the benefits of working capital. “Select public companies posting negative EBITDA margin while generating positive CFO in 2Q18 include Box, Coupa, Nutanix, Proofpoint, Twilio, Workday, and Zendesk.”
Median Revenue Multiples are 7.6x Revenue
Also noteworthy, “37.8% of SaaS companies posted a revenue multiple of 9.0x or greater in the second quarter. That made this the largest percentage of companies to do so since 2Q15. Select companies moving into the 9.0x + bucket in 2Q18 include 2U, AppFolio, Everbridge, HubSpot, New Relic, Paycom, Proofpoint, Talend, and Twilio.”
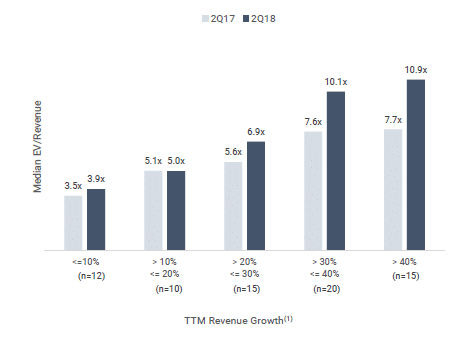
Growth Drives the Multiples
“Revenue multiples have long shown a very strong correlation to revenue growth, a trend that continued during 2Q18. Companies growing 40% or greater posted a median revenue multiple of 10.9x in 2Q18. That’s a sharp increase over the same cohort last year (7.7x).”
Conversely, companies failing to achieve greater than 10% revenue growth posted a median EV/Revenue multiple of 3.9x in 2Q18. That’s approximately 50% below the Index median (7.6x). Interestingly, SEG does not see a strong correlation between EBITDA margin and valuation.
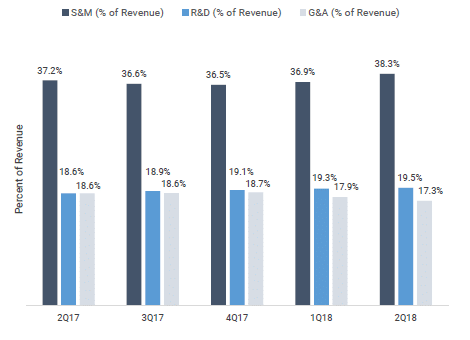
40/20/20 Is the Ratio of S&M/R&D/G&A Expense
Of the 74 SaaS companies, on average they spend roughly 40% of revenue on sales and marketing, 20%on R&D, and 20% and general and admin expenses.
SEG’s report is thorough, frames multiples relative to two of the most important factors in any SaaS business (margin and growth). It also shows that right now is a great time to raise money or sell as multiples continue to be high.