How fast does a company need to grow prior to exiting successfully? We looked at the full year revenue of 127 tech companies prior to going public to find out the growth rate of a successful exit.
Upgrade to Crunchbase Pro to perform your own market research.
Note, the S1 filing below is the year the company filed their S1. An S1 is like a prospectus every company must file prior to going public and it contains full-year financials.
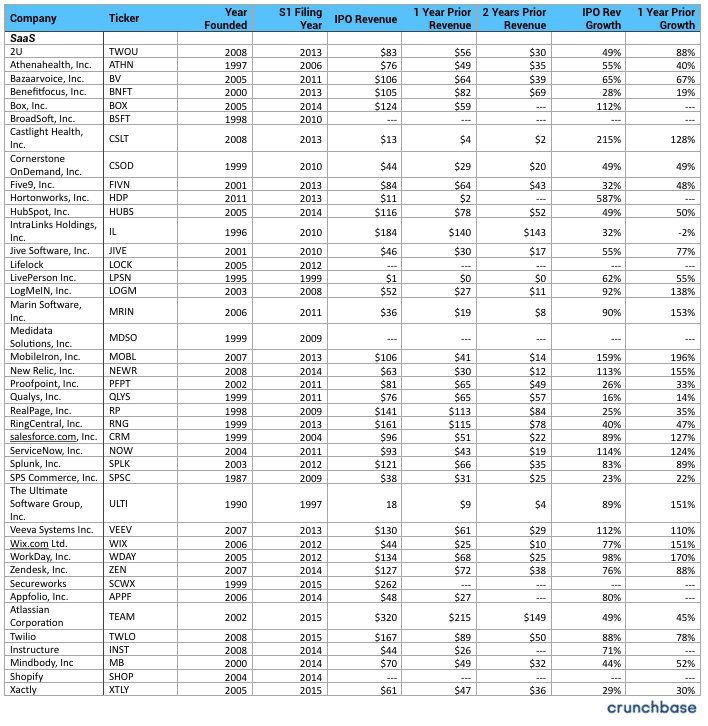
The growth rate for SaaS companies that have exited
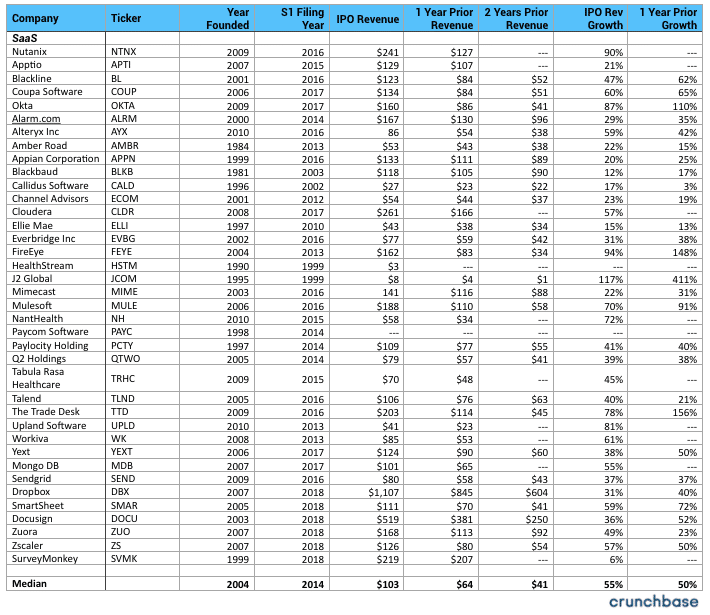
Software companies posted a median revenue of $103mm in the year prior to going public with 55% median growth. Revenue in the two years prior to that was $64mm and $41mm respectively. The range of growth was wide: the minimum level of growth was 6% by SurveyMonkey, while the highest growth rate was Hortonworks at 587%. The median level of revenue needed to go public has increased over time.
For companies that filed their S1 in 2018, 2017, 2016, and 2015, median revenue levels each year were $193mm, $134mm, $128mm, and $129mm. Alternatively, the median levels in 2012, 2011, and 2010 were only $87mm, $81mm, and $45mm. The bar to go public/exit is rising.
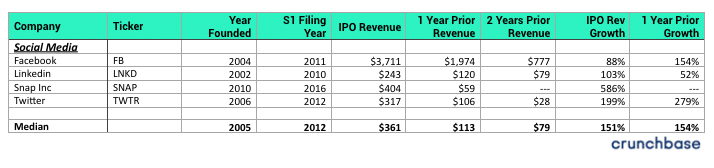
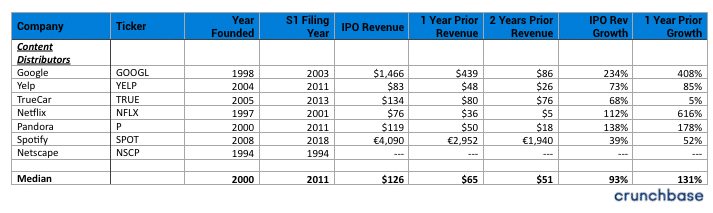
The growth rate for Social Media companies that have exited
Social media companies had a median revenue of $361mm with 151% revenue growth prior to IPO. Revenue in years prior was $113mm and $79mm, meaning revenue growth was a strong 154% 2 years before IPO.
The consistency in median revenue growth is remarkable. SaaS companies that exited showed similar consistency, with revenue growth of 55% and 54% in the years prior to going public.
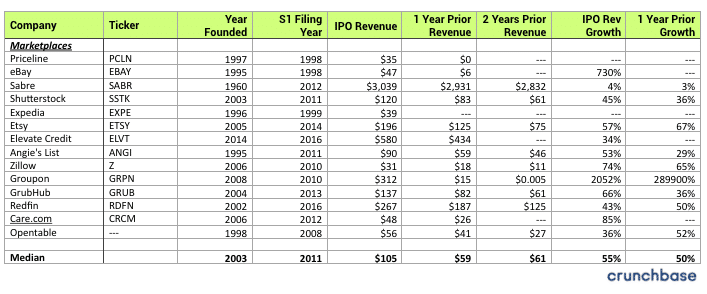
The growth rate for Marketplace companies that have exited
Marketplace companies look a lot like SaaS companies, with $105mm of revenue on a median and 55% and 50% revenue growth in the years leading to IPO.
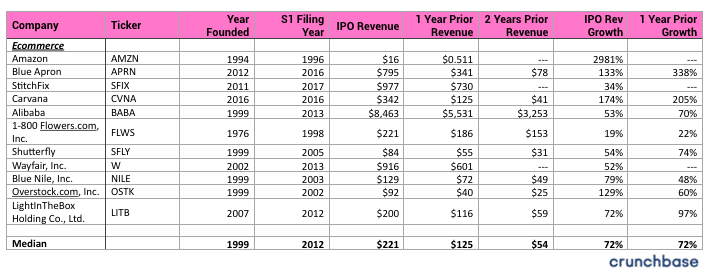
The growth rate for E-commerce companies that have exited
On median, these businesses had $221mm of revenue prior to going public with consistent growth of 72% in the years prior. It’s pretty incredible to think that Amazon went public with only $16mm of revenue, but that was actually a lot of revenue for a new tech company in the 90’s.
Learnings when looking at growth rates of exited companies
Overall the themes are that prior to exit, growth rates for startups either needs to be consistent in prior years or if it’s declining, it needs to still be quite high — for instance, content distributors had revenue growth of 131% 2 years prior to IPO and 93% prior to IPO so while there was a decline, 93% was nothing to sneeze out.
The data should also give you a sense that the amount of revenue needed to go public has increased dramatically over the past two decades.
Sammy is a co-founder of Blossom Street Ventures. They invest in companies with run rate revenue of $2mm+ and year over year growth of 50%+. We can commit in 3 weeks and our check is $1mm. Email Sammy directly at sammy@blossomstreetventures.com.